QTP Tutorial for Beginners
QuickTest Professional, or UFT (Unified Functional Testing), was formerly known as QTP. Software testers can automate a variety of testing tasks, including data-driven testing, regression testing, and functional testing, with the use of QTP/UFT. Learn the fundamentals in this QTP tutorial and begin your learning journey to become a software tester.
Introduction to QTP
QuickTest Professional, or QTP for short, is a Hewlett-Packard (HP) product. After the script is developed, this tool assists testers in carrying out automated functional testing without difficulty and supervision. We cover the following in this QTP tutorial:
- Overview of QTP
- QTP Environment Setup
- Record and Playback in QTP
- Object Repository in QTP
- QTP Terminologies
- Debugging with QTP
- Error Handling in QTP
- Environment Variables in QTP
- Library Files in QTP
- Test Results in QTP
- Advantages of QTP
Overview of QTP
QTP is a functional testing tool that works well for regression testing in particular application categories. It is regarded as one of the most widely used tools on the market and comes in many variants, including the licensed, commercial version.
- It was eventually purchased by HP from Mercury Interactive, the original owner.
- Astra Quick Test was its initial name; Quick Test Professional was the new name.
- The most recent iteration of it is now referred to as the Unified Functional Tester.
Reshape your career with our manual testing training in Chennai.
QTP Environment Setup
QTP is a paid utility, and you can get the trial version straight from the HP website. Downloads are limited to the most recent version, which is Unified Functional Testing 11.5x.
Installation Procedure
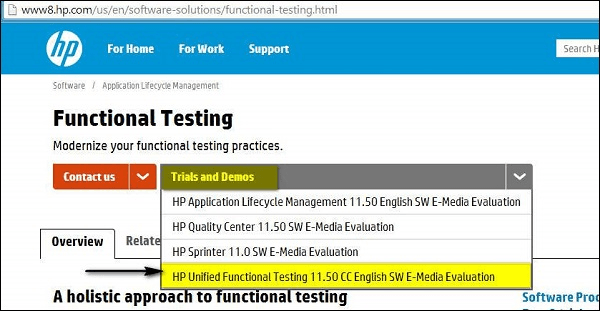
Step 1: As indicated below, click the “Trials and Demos” link and choose “HP Unified Functional Testing 11.50 CC English SW E-Media Evaluation.”
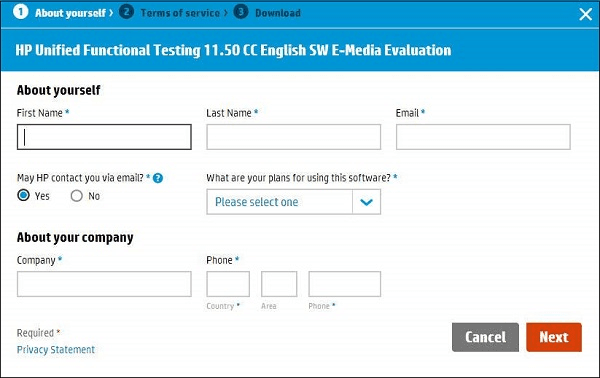
Step 2: You pick it, and the “HP Unified Functional Testing 11.50” download wizard opens. After completing the personal information, click Next.
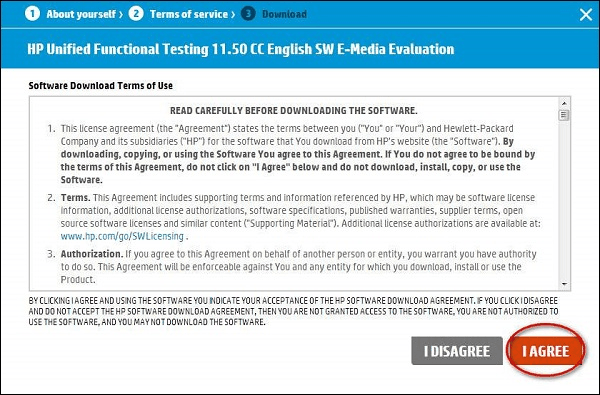
Step 3: Click “NEXT” after reading the “Terms of Use.”
Step 4: The window for downloading opens. Press the “Download” button now.
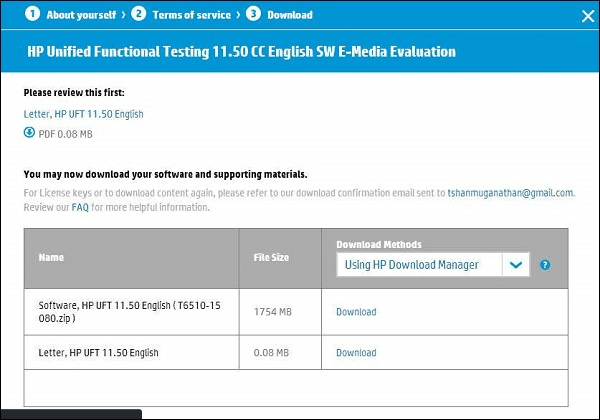
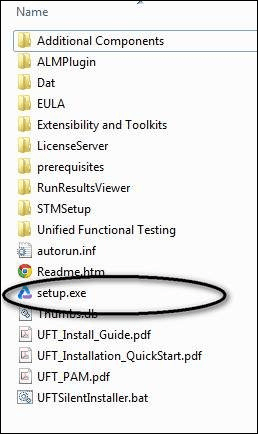
Step 5: The file you download will be in “.RAR” format. The archive must now be unzipped, and the contents of the folder should appear as follows: Next, run Setup.exe.
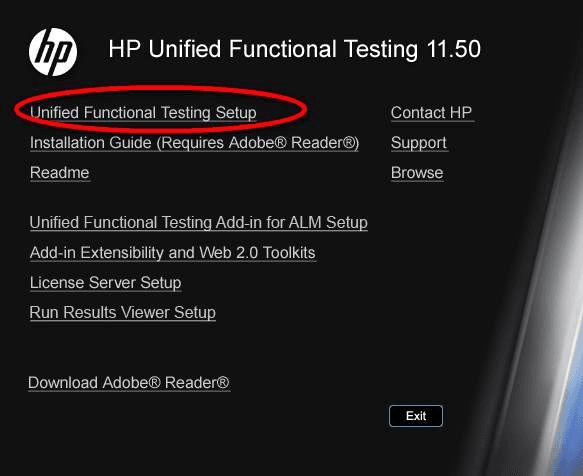
Step 6: After running the setup file, choose “Unified Functional Testing Set up” from the list as indicated below to begin the installation process.
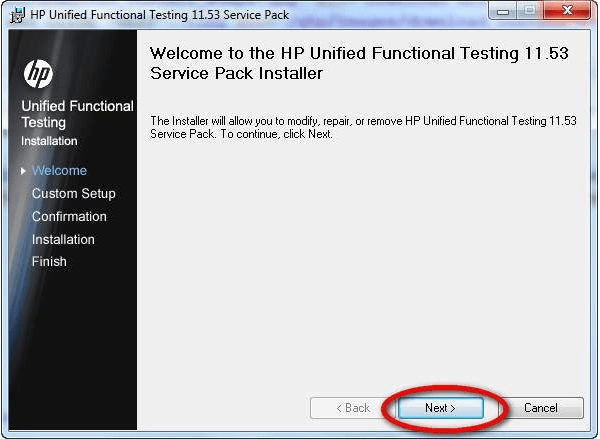
Step 7: To proceed, click Next.
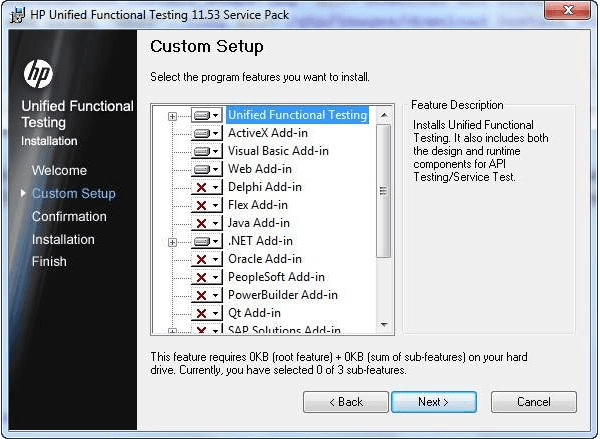
Step 8: Choose the plugins needed for your automation in the Custom Setup Window; in other words, choose the plugins according to the technology of the application you are testing.
For example, you should be sure to choose .NET if your application is built on the .NET framework.
Step 9: Click Next once you have chosen the plugins that need to be installed. There will be a Finish button window once the installation is finished.
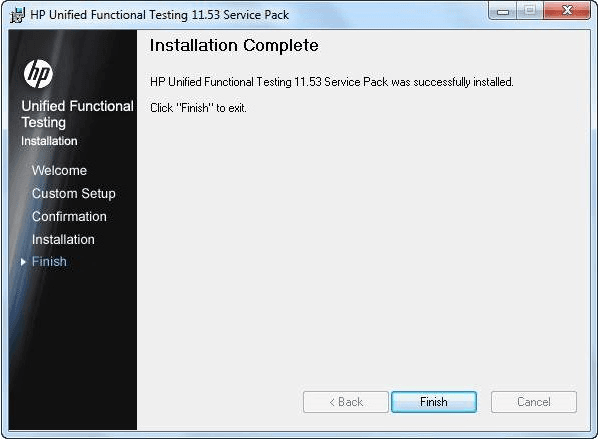
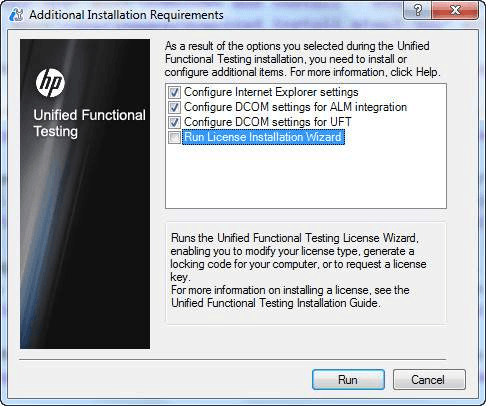
Step 10: The dialog box labeled “Additional Installation Requirements” appears once the installation is finished.
Click “RUN” after selecting every option in the list except for “Run License Installation Wizard.”
Since we are installing the trial version, which by default grants a license for 30 days, we do not need to select “Run License Installation Wizard.”
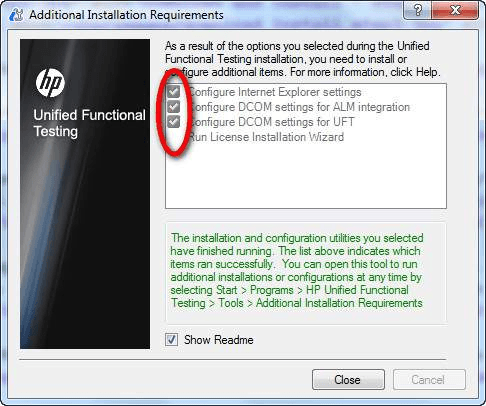
Step 11: A checkmark indicating the successful installation of the components appears after fulfilling the additional installation requirements. Click Close now.
UFT Launching and Adding Pages
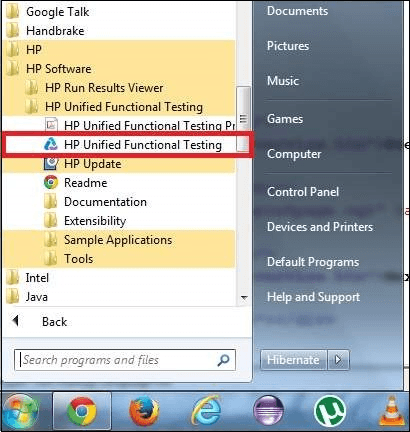
Step 1: As seen in the example, the application can be opened from the Start Menu after installation.
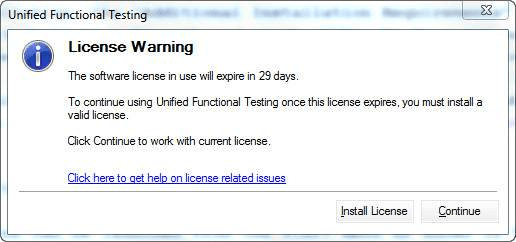
Step 2: The page with the license displays. Now that the trial license has been installed, you can click Continue.
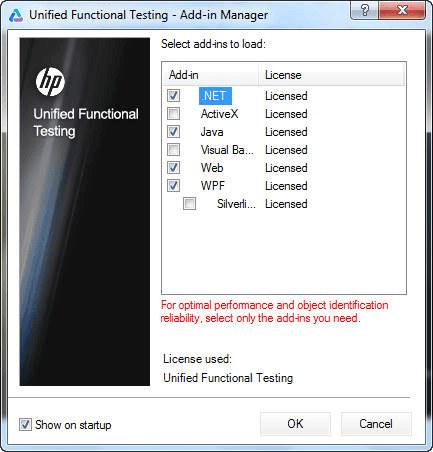
Step 3: The user can choose the necessary add-ins by opening the Add-ins dialog box.
Note: Only load the necessary add-ins and click OK instead of loading all of them.
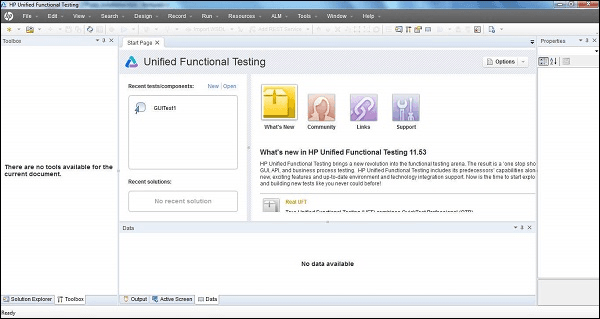
Step 4: Once the necessary add-ins have been loaded, the user can access the UFT 11.5 tool. The initial view of the UFT appears as follows:
Record and Play Back
For UFT to automatically create the scripts that may be played back, recording a test entails recording the user activities of the application that is being tested.
If the first settings are done correctly, Record and Playback can offer us an initial view of the tool, including whether or not it can support the technology.
The following are the steps to record and replay:
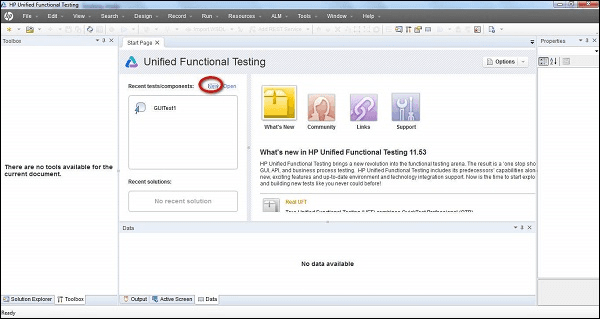
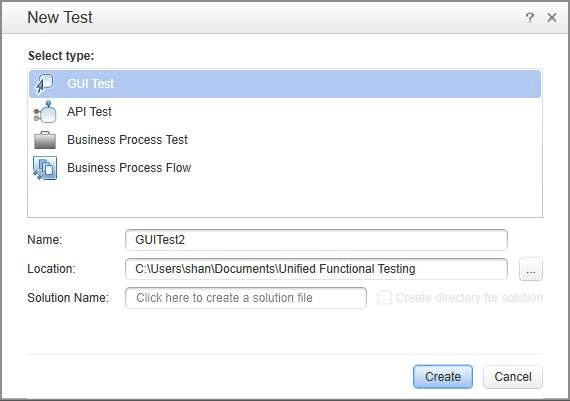
Step 1: As indicated below, select “New” test from the Start Page.
Step 2: After clicking the “New” link, a new test window appears, requiring the user to choose the type of test. Choose “GUI Test,” provide the test’s name, and choose the location where it should be saved.
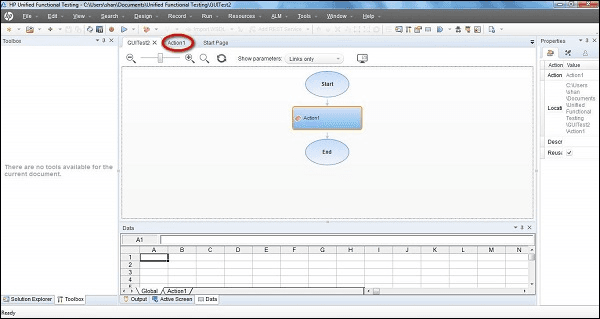
Step 3: The new test screen appears as indicated below after a new test has been generated. Click the “Action1” tab now. By default, this tab has only one action created.
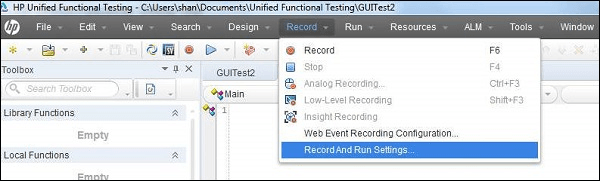
Step 4: Select “Record and Run Settings” from the “Record” Menu, as seen below.
Step 5: When the Record and Run Settings dialog box appears, choose Web, Java, or Windows Applications depending on the kind of application. We’ll record an example of a web-based application here: http://easycalculation.com/.
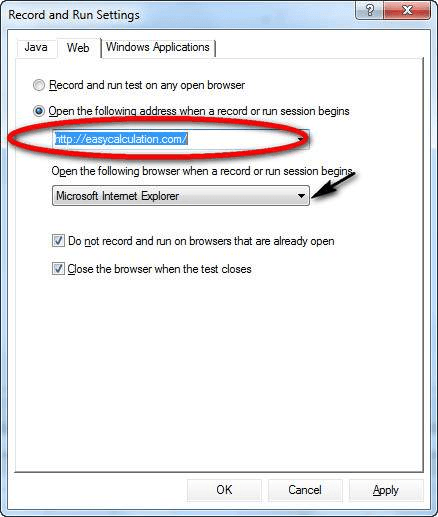
Step 6: Press Record. Depending on the settings, Internet Explorer opens immediately with the web address https://www.easycalculation.com/.
- Choose “Numbers” from the “Algebra” menu, enter a number, and then select “Calculate.”
- Click “Stop” on the record panel’s button once the action is finished.
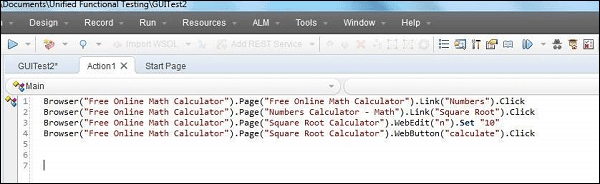
You’ll see that the script is generated as indicated below.
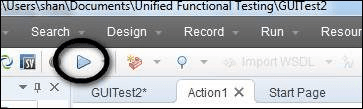
Step 7: Click the replay button to begin playing the script. The outcome is shown when the script replays.
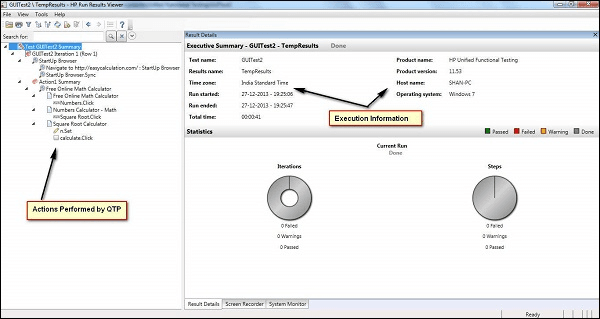
Step 8: By default, the result window opens and displays the precise execution timestamp along with the passed and failed phases.
Importance of Record and Playback
- It is employed as a means of the first study to confirm whether UFT is capable of supporting the application or technology.
- It is used to develop and test an application’s or feature’s fundamental functionality that doesn’t need ongoing maintenance.
- Keyboard inputs as well as mouse movements can be recorded using it.
Kickstart your testing career by understanding the fundamentals with our software testing training courses in Chennai.
QTP Terminologies
Object Repository: An object repository is a set of objects and their attributes that QTP can use to identify and manipulate things. By default, the objects and their properties are recorded when a user records a test. QTP cannot play back scripts if one does not grasp objects and their properties.
Actions: Testers can organize scripts into groups of QTP statements using actions. In VBScript, actions and functions are similar, although there are some distinctions. QTP generates a test with one action by default.
DataTable: Like Microsoft Excel, a DataTable aids in the creation of data-driven test cases that allow an action to be executed repeatedly by the testers. Two categories of DataTables exist.
- Local DataTable: Every action has a local datatable, which is a private datatable that is accessible from one action to another.
- Global DataTable: Every test comprises a single global data sheet that may be accessed from any activity.
Checkpoints: Checkpoints are validation points that may be added to the script at any moment and compare the current value of an object or the provided properties’ current state to the intended value.
Synchronization: The time interface between the tool and the tested application is known as the synchronization point. The test script’s synchronization point functionality allows you to define how much time should elapse between two steps.
Smart Identification: Occasionally, QTP finds more than one thing that meets the recognized object description, or it finds none at all. In these cases, QTP disregards the recognized description and recognizes the object via the Smart Identification process. Gain expertise with our API testing training in Chennai for a promising career.
Debugging with QTP
In the context of automation testing, debugging is the methodical process of identifying and resolving code errors in the automation script to strengthen it and enable it to identify application faults.
In QTP, there are several approaches for debugging with breakpoints. Inserting breakpoints is as simple as hitting “F9” or selecting “Inserting/Removing Break Point” under the “Run” menu option.
The line and the “Red Colored” dot will be highlighted in red as soon as the breakpoint is inserted, as seen below:
- F11: Step Into: Utilized to carry out every single step. enters the function/action and begins line-by-line execution. After each line of execution, it pauses.
- F10: Step Over: Employed to Cross the Function. Only the current step in the active document is executed by Step Over.
- Shift+F11: Step Out: The Step Out command can be used after Step Into the function. At the next line, Step Out stops the run session and carries on running until the end of the function.
Options in Break Point
By navigating the ‘Run’ menu in BreakPoint, you can access a variety of options.
- F9: Insert/Remove BreakPoint
- Ctrl+F9: Enable/Disable BreakPoint
- Ctrl+Shift+F9: Clear All BreakPoint
- Use Only Menu: Enable/Disable All BreakPoints
Debugging Pane
The panes of the debugging window are as follows:
- Output: All of the Print Statements’ output is shown on this tab.
- Watch: The boolean result of the given expression is shown on this tab.
- LocalVariables: The output of the local variables is shown on this tab.
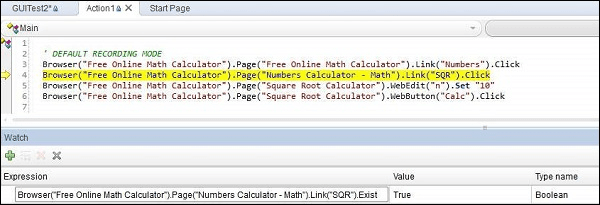
Example:
The output expression is displayed in the Watch Pane as follows:
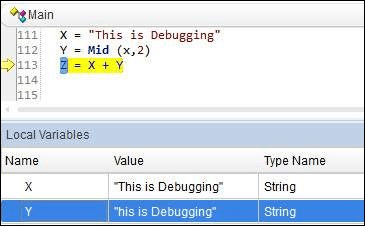
The values contained by the local variables are displayed in the Local Variables Pane as follows:
Interested in testing Java-based apps? Enhance your skills with our JMeter training in Chennai.
Error Handling in QTP
In QTP, errors can be handled in many ways. Three different kinds of errors can occur when using QTP. They’re
- Syntax Errors
- Logical Errors
- Run Time Errors
Syntax Errors
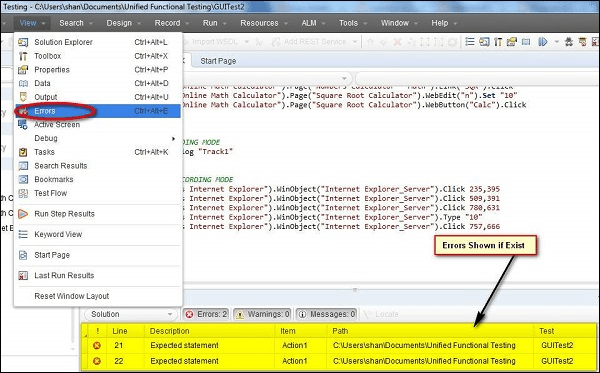
Typos or sections of code that do not follow the syntax rules of the VBscripting language are known as syntax errors. When code is compiled, syntax errors arise and prevent the code from running until they are corrected.
Using the keyboard shortcut Ctrl+F7, you may check the syntax and see the outcome as illustrated below. If the window is not visible, go to “View” → “Errors.”
Logical Errors
A logical error occurs when a script that is syntactically correct yields unexpected effects.
Typically, a logical error results in inaccurate data but does not stop the execution.
Many factors can lead to logical errors, including faulty assumptions, misinterpretations of the need, and occasionally flawed program logic (e.g., employing do-while instead of do-until) or infinite loops.
Conducting peer reviews and confirming that the tool has operated as intended by looking through the QTP output file and result file are two methods to find logical errors.
Run Time Errors
Run time is when this type of issue occurs. These kinds of errors occur when a script tries to do something but is unable to do so; as a result, the script often stops trying to execute the task. Typical instances of run-time errors are:
- The script is attempting to read the file, but it is not found.
- Object not found, although the script is attempting to interact with that specific object
- When attempting to retrieve array elements, dividing an integer by the Zero Array Index is out of limits.
Accelerate your career with our Appium testing training in Chennai.
Handling Run-Time Errors
Code errors can be handled in many ways.
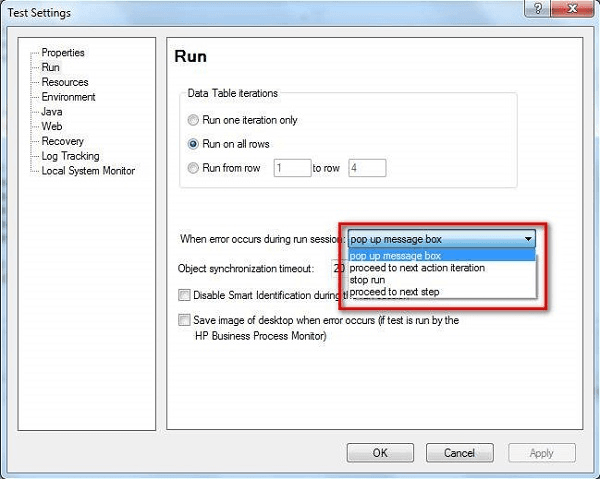
Using Test Settings
By navigating to the “File” >> “Settings” >> “Run” Tab, as indicated below, error handling can be specified in the Test Settings. We can click “OK” after selecting any of the available parameters.
Using “On Error Statement”
Rather than letting the VBScript engine display unhelpful error messages, the ‘On Error’ statement is used to inform the engine of a tester’s desire to manage run-time problems.
- On Error Resume Next: When an error occurs, On Error Resume Next instructs the VBScript engine to proceed with processing the subsequent line of code.
- On Error Goto 0: To help the testers turn off error handling, use the On error Goto 0 function.
Using Err Object
VBScript has a built-in object called Error that allows us to easily debug code by capturing the run-time error number and error description.
- Err.Number: This property assigns or receives a numerical value indicating an error. No error has occurred if the value of Err.Number is 0.
- Err.Description: An error’s brief description is returned or set using the Description property.
- Err.Clear: The Err object is reset and all of its associated prior values are cleared via the Clear method.
Example
Function Addition(a,b)
On error resume next
If NOT IsNumeric(a) or IsNumeric(b) Then
Print “Error number is ” & err.number & ” and description is :
” & err.description
Err.Clear
Exit Function
End If
Addition = a+b
‘disables error handling
On Error Goto 0
End function
Using Exit Statement
To end a test, action, or iteration depending on the value of Err.Number, and exit statements can be used in conjunction with the Err object. Let’s examine each of those exit statements in greater depth.
- ExitTest: Regardless of the run-time iteration settings, exits the whole QTP test.
- ExitAction: Ends the active activity.
- ExitActionIteration: Ends the action’s current iteration.
- ExitTestIteration: Ends the current QTP test iteration and moves on to the subsequent one.
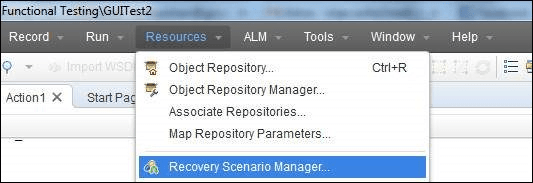
Recovery Scenarios
It is activated based on specific conditions when an error occurs.
During the QTP script execution, unforeseen errors may occur. Recovery scenarios are used to recover the tests from these unexpected errors so that the rest of the script can continue to run.
To access the Recovery Scenario Manager, navigate to “Resources” → Recovery Scenario Manager, as displayed below.
Reporter Object
This tool facilitates the reporting of events to the run results. We can use it to determine whether a step or activity is successful or unsuccessful.
Syntax: Reporter.ReportEventEventStatus, ReportStepName, Details,
[ImageFilePath]
Example: Reporter.ReportEvent micFail, “Login”, “User is unable to Login.”
Our LoadRunner training course helps you kickstart your career in software testing. Enroll now.
Environment Variables in QTP
All actions, function libraries, and recovery scenarios have access to QTP environment variables, which are unique types of variables.
While QTP environment variables are exclusively accessible to that specific test script during run-time, Windows environment variables are open to all apps running on that specific system.
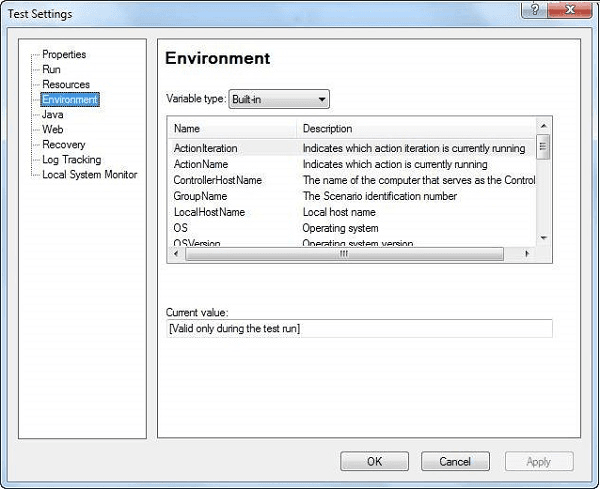
Types of Environment Variables
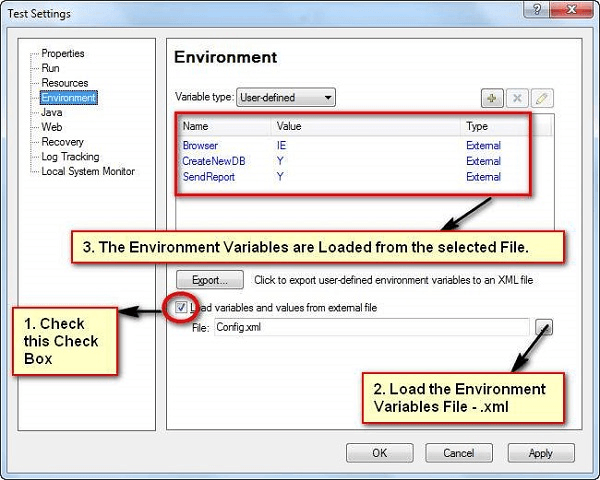
A variety of environment parameters, including test name, action name, test path, local hostname, operating system name, type, and version, are provided by built-in environment variables. To view the names of the environment variables, go to “File” → “Test Settings” → “Environment” Tab.
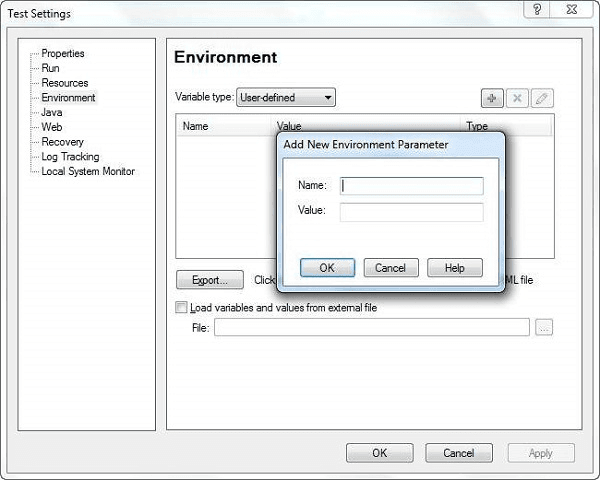
By choosing “User Defined” in the Environment Tab Window, user-specified internal variables can be preserved. To enter the parameter Name and Value, click the “+” button as indicated below:
User-Defined External: As seen in the following figure, User-Defined Variables can be fed into the test by storing them as a “.xml” file in an external file. It can also be dynamically loaded at runtime, as one of the examples below explains.
Supported Methods
Here are the supported methods of environment variables:
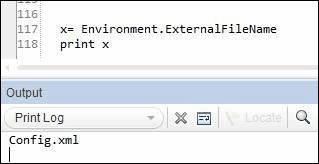
ExternalFileName Property
It provides the name of the external environment variable file that has been loaded, as indicated in the Test Settings dialog box’s Environment tab. This property returns an empty string if there is no external environment variable file loaded.
x = Environment.ExternalFileName
print x
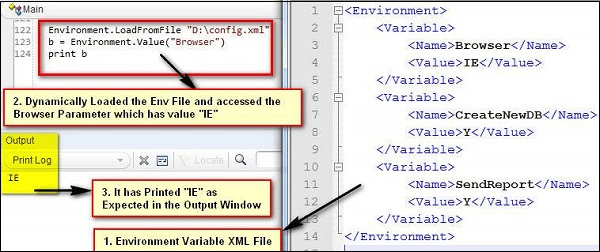
LoadFromFile Method
This method dynamically loads the provided environment variable file (.xml) at runtime. It is not necessary to manually add the environment variables to the Environment Tab while utilizing this strategy.
Environment.LoadFromFile “D:\config.xml”
b = Environment.Value(“Browser”)
print b
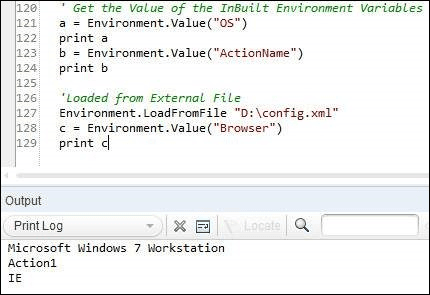
Value Property
It obtains the environment variables’ values. This property can also be used to set the value of user-defined internal environment variables.
‘ Determine the Inbuilt Environment Variables’ Value
a = Environment.Value(“OS”)
print a
b = Environment.Value(“ActionName”)
print b
‘Environment loaded from external file.
Environment.LoadFromFile “D:\config.xml”
c = Environment.Value(“Browser”)
print c
Library Files in QTP
Library files are added to the QTP Script to modularize the script. It includes declarations for variables, functions, classes, etc. They make it possible for reusability to be transferred between test scripts. They are saved with an extension “.vbs or .qfl.”
You can create a new library file by going to “File” >> “Function Library“.
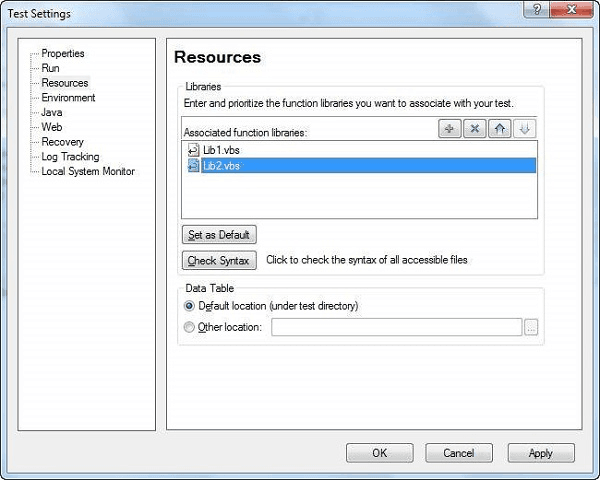
Associating Function Libraries
Method 1: Associating Function Libraries
Utilizing the “File” > “Settings” > Resources > Associate Function Library menu. To add a Function Library file, click the “+” button and use the relative or actual path as indicated below:
Method 2: Using the ExecuteFile method
‘Syntax : ExecuteFile(Filepath)
ExecuteFile “C:\lib1.vbs”
ExecuteFile “C:\lib2.vbs”
Method 3: Using LoadFunctionLibrary Method.
‘Syntax : LoadFunctionLibrary(Filepath)
LoadFunctionLibrary “C:\lib1.vbs”
LoadFunctionLibrary “C:\lib2.vbs”
Method 4: Automation Object Model(AOM)
It’s a framework that lets us manage different QTP operations from outside of QTP. We can start QTP, open the test, associate function libraries, and do other things using AOM.
The following VbScript needs to be saved with the.vbs extension. When it is executed, QTP will open and the test will begin.
‘Launch QTP
Set objQTP = CreateObject(“QuickTest.Application”)
objQTP.Launch
objQTP.Visible = True
‘Open the test
objQTP.Open “D:\GUITest2”, False, False
Set objLib = objQTP.Test.Settings.Resources.Libraries
‘Associate Function Library if NOT associated already.
If objLib.Find(“C:\lib1.vbs”) = -1 Then
objLib.Add “C:\lib1.vbs”, 1
End
Upgrade your software testing skills with automation testing through our Selenium training course in Chennai at SLA.
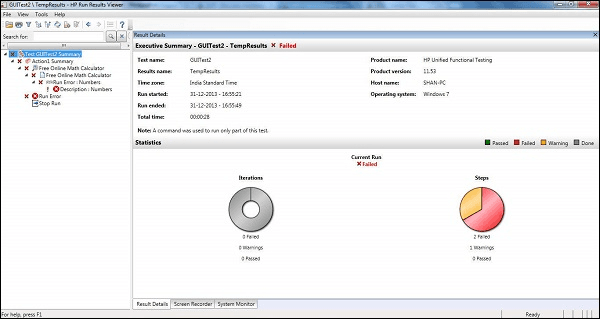
Test Results in QTP
We have enough information in the Test Results Window to display the stages that were successful, unsuccessful, etc. The Results pane (by default) opens automatically following the test run. The data that is shown is as follows:
- Steps Passed
- Steps Failed
- Environment Parameters
- Graphical Statistics
Operations Performed in Test Results
Transforming Search Results into HTML
Go to “File” → “Export to File” in the Results Viewer box. Export The dialog box for “Run Results” appears as seen below:
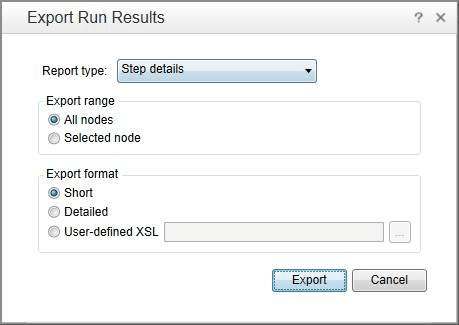
The kind of report that is exported is something we may select. Short results, comprehensive results, or even node selection are all possible. The file is saved as “.HTML File” after choosing the file name and exporting it.
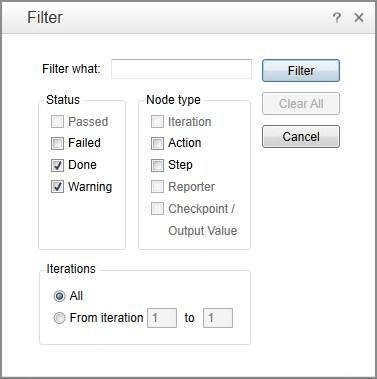
Filtering the Results
Iterations, Node Type, and Status can all be used to filter results. The Filter button in the “Test Results Window” provides access to it.
Raising Defects
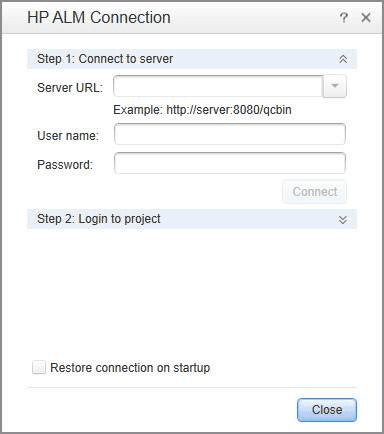
You can access “Tools” → “Add Defect” to open the connection to ALM and log defects directly into QC from the Test Results window pane, as shown below.
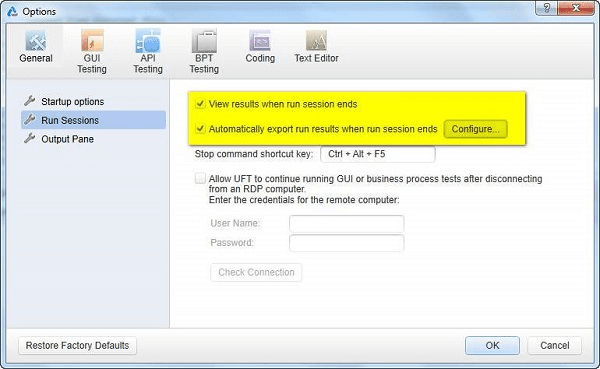
Test Results
The “Tools” → “Options” → “Run Sessions” Tab is where you may configure the Automatic Test Results Window. In addition to turning it ON (“Automatically Export Results when session Ends”), we can turn it OFF when necessary.
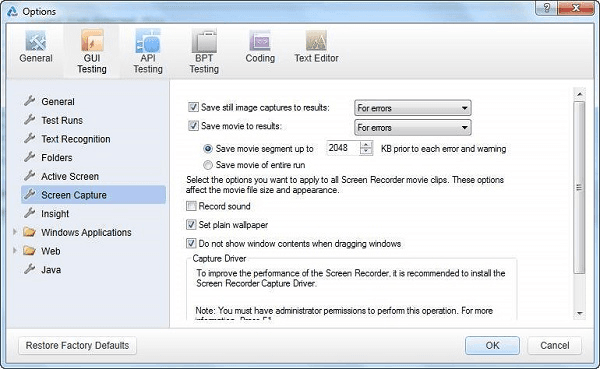
Depending on the settings, either the movie or the screenshot can be recorded. You may adjust the same thing by going to “Tools” → “Options” → “Screen Capture” Tab. The following three requirements can determine whether we can preserve the screenshot:
- For Errors
- Always
- For Errors and Warnings
Advantages of QTP
There are numerous benefits of Quick Test Professional (QTP), such as:
- Easy to use: Non-technical users may easily learn and develop test cases using QTP due to its straightforward UI.
- Effective management of test data: QTP effectively manages test data.
- Maintainable: It is simple and rapid to make changes to the underlying code.
- Reused: Code can be repurposed or reused.
- Robust Test Reports: Test reports with greater substance than those from other functional testing tools are provided by QTP.
- Record and playback: To assist testers in referring to screen object properties, QTP records scripts on an active screen.
- Add-ins supported: QTP is compatible with a wide range of add-ins, such as Web Forms, PeopleSoft, Java, SAP, Oracle, and NET.
- Unified Functional Testing: The procedure will carry out the subsequent test case and report the faults if a test script fails.
- Point-and-click interface: QTP’s point-and-click interface facilitates the creation of tests that can be repeatedly played back on an application.
Conclusion
QTP helps testers find flaws in the software product by simulating user actions on desktop or web applications. We hope this QTP tutorial will be helpful to you. Learn comprehensively with practical exposure in our QTP training in Chennai.