Tableau Tutorial for Beginners
A job as a Tableau Developer in India is a promising option for individuals passionate about data visualization and analytics, offering competitive compensation, many prospects for career advancement, and a bright future. Learn the fundamentals of data visualization with this Tableau tutorial designed for beginners. Explore various IT courses that help you begin your IT career.
Introduction to Tableau
Tableau offers solutions for various departments, industries, and data settings. We cover the following in this Tableau tutorial:
- Overview of Tableau
- Tableau Environment
- Basic Operations in Tableau
- Navigation in Tableau
- Design Flow in Tableau
- Data Types in Tableau
- Advantages of Tableau
Overview of Tableau
Tableau is a popular data visualization application with many interesting features.
The drag-and-drop interface of Tableau allows you to effortlessly visualize any type of data, experiment with various views, and even merge multiple datasets.
The following special features give Tableau the ability to manage a variety of scenarios:
- Speed of Analysis: Any user with access to data can begin using it to extract value from data because it does not require a high level of programming expertise.
- Independent: Tableau doesn’t require a complex software configuration. Major customers utilize the desktop version, which is simple to install and has all the functionality to begin and finish data analysis.
- Visual Discovery: Using visual aids like colors, trend lines, charts, and graphs, the user examines and evaluates the data. It is not required because almost everything can be done with drag and drop.
- Blend Diverse Data Sets: Tableau enables real-time blending of many relational, semistructured, and raw data sources without incurring high upfront integration expenses.
- Architecture Agnostic: Tableau operates on a wide range of devices where data is transferred. Because of this, using Tableau does not require the user to be concerned about any particular hardware or software.
- Real-Time Collaboration: Tableau can embed a live dashboard in portals such as Salesforce or SharePoint sites, and it can filter, sort, and discuss data on the fly.
- Centralized Data: The Tableau server offers an all-in-one spot to handle all of the published data sources for the company. On the server, administrators can centrally set up a timetable for extracts for both partial and complete refreshes.
Explore what our data science full-stack job seeker program has in store for your career.
Environment Setup
Tableau Desktop offers a free personal edition that you can download. To download, you must register with your information.
Once the file has been downloaded, installing it only requires you to accept the license agreement and give the installation destination folder.
The setup procedure is explained in detail in the stages and screenshots that follow:
- Launch the Installation Wizard: To open TableauDesktop-64bit-9-2-2.exe, double-click it. It will show a screen so that the installation software can begin. Press “Run.”
- Accept the License Agreement: After reading the licensing agreement, select the “I have read and accept the terms of this license agreement” option if you agree with it. Click “Install” after that.
- Start Trial: You are presented with a screen prompting you to either start the trial immediately or later upon installation completion. You can opt to begin it right away. You can enter the license key if you have purchased Tableau.
- Provide Your Details: Enter your name and organization details. Click “Next” after that.
- Completed Registration: The screen indicating the completion of registration appears. Select “Continue.”
- Check the Installation: By navigating to the Windows start menu, you can confirm the installation. Press the Tableau symbol.
Now, you are all set to learn Tableau! Explore our Tableau course syllabus.
Basic Operations in Tableau
Any Tableau data analysis report can be created in three simple steps. These are the three steps:
- Connect to a Data Source: This entails finding the data and reading it using the right kind of connection.
- Select Measurements and Dimensions: This entails figuring out which columns from the source data need to be analyzed.
- Apply a Visualization Approach: This entails applying required visualization methods, such as a specific chart or graph type, to the data being studied.
Connect to a Data Source
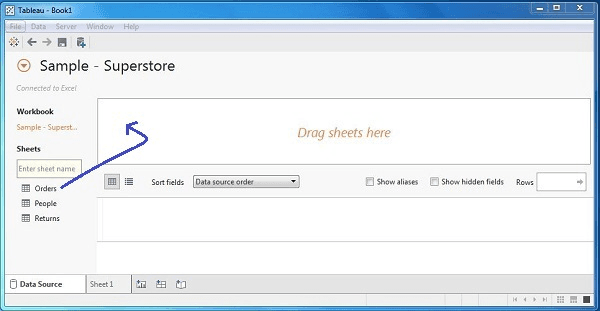
- On opening Tableau, you will receive the start page presenting multiple data sources.
- There are choices to select a file, server, or saved data source under the “Connect” header.
- Select Excel from Files. Next, as previously indicated, navigate to the file “Sample – Superstore.xls.” Orders, People, and Returns are the three sheets that make up the Excel file.
- Select your orders.
Select Measurements and Dimensions
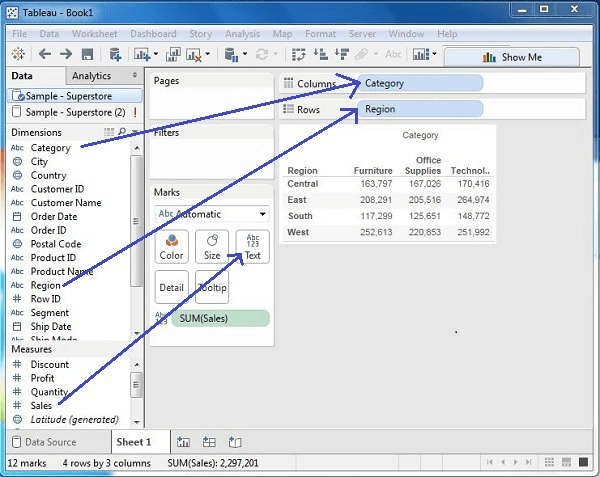
- Next, select the data to be examined by determining the measurements and dimensions. Measures are numerical data, whereas dimensions are descriptive data.
- When combined, they aid in the visualization of the dimensional data’s performance of the measured data.
- Select Sales as the measure and Category and Region as the dimensions. Drag and drop them, as the screenshot below shows.
- The total sales for each region in each category are displayed in the result.
Apply Visualization Technique
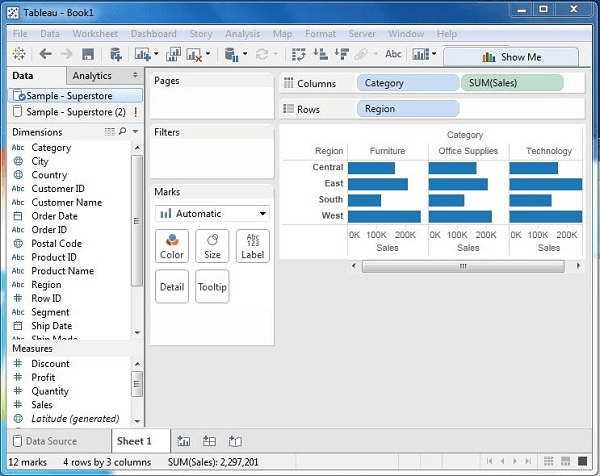
- In the previous stage, you can see that the data is provided solely as numbers.
- To evaluate the performance, you must read and compute each value.
- To reach a decision more quickly, you can view them as colored graphs or charts.
- The total (sales) column is dragged and dropped on the Columns shelf from the Marks tab.
- Now, a bar chart is automatically created from the table displaying the sales numbers numerically.
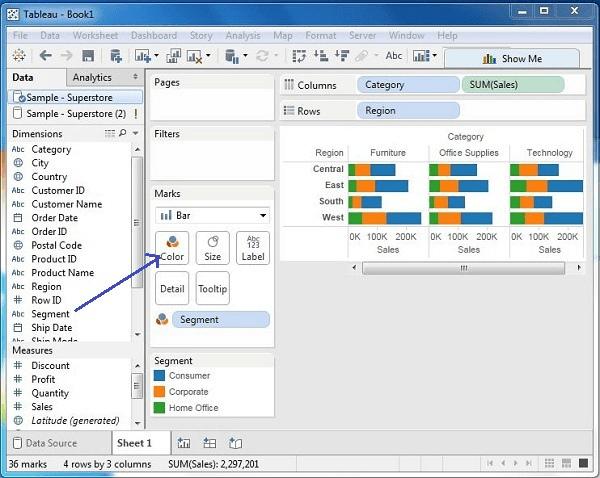
You can use a method to give the current data an additional dimension. This will enhance the current bar chart with additional colors, as seen in the screenshot below.
Navigation with Tableau
When Tableau Desktop is launched, a menu at the top displays all of the navigable commands. Let’s open a new workbook and review the many crucial elements shown beneath each option.
Menu Commands
Upon dismissing the getting started box, the primary interface with all of the “menu” commands becomes accessible.
- They are all of the features that Tableau has to offer.
- Various areas of the menu are displayed in the following diagram.
- You can then view some of each menu’s details.
File Menu
Using this option, you can open and create new Tableau workbooks from the Tableau server as well as the local system.
The salient characteristics of this menu are:
- The language to be used in the report is set by Workbook Locale.
- Paste Sheets copies a sheet from another workbook into the current worksheet.
- The export packaged workbook option is used to create a packaged workbook, which will be shared with other users.
Data Menu
This option is used to create new data sources to acquire the data for analysis and visualization. You can also use it to upgrade or replace the current data source.
The following are the salient characteristics of this menu:
- The New Data Source makes it possible to see and select from any kind of connection.
- Refresh All Extracts updates the source data.
- The Edit Relationships option defines the fields in more than one data source for linking.
Worksheet Menu
Using this menu, you may make a new worksheet and add other display options, such as displaying the title and captions, among other things.
The following are the salient characteristics of this menu:
- Viewing the summary of the data used in the worksheet, such as count, is possible with the Show Summary feature.
- When the tooltip is hovered over different data fields, it displays.
- The spreadsheet data or filters are updated by using the Run Update option.
Dashboard Menu
Using this menu, you can export the image and show the title, among other display features, and build a new dashboard.
The following are the salient characteristics of this menu:
- The color scheme and sectional layout of the dashboard are determined by the format.
- Actions are used to link the dashboard sheets to other sheets or external URLs.
- The Dashboard image can be exported using the Export Image option.
Story Menu
Using this menu, you can start a new tale with many linked sheets or dashboards. The following are the salient characteristics of this menu:
- The format determines the story’s sections and color scheme.
- Run Update adds the most recent information from the source to the story.
- A story image can be exported using the Export Image option.
Kickstart your IT career with our data science courses in Chennai.
Analysis Menu
The data in the sheet can be analyzed using this menu. Tableau offers a plethora of pre-built functions, like percentage calculations and forecasting, among other things.
The following are the salient characteristics of this menu:
- A forecast displays a prediction made using the data at hand.
- Trend lines illustrate the trend line for a collection of data.
- By using a specific calculation on the current data, the Create Calculated Field option adds new fields.
Map Menu
In Tableau, this option is used to create map views. Fields in your data can have geographic roles assigned to them. The following are the salient characteristics of this menu:
- Map Layers adds data layers and conceals and displays map layers, including nation borders and street names.
- New geographic roles are generated by geocoding and assigned to the geographic fields in your data.
Format Menu
The different formatting settings can be applied using this menu to improve the dashboards’ appearance and feel. It offers elements like text alignment, color, and borders, among others.
The following are the salient characteristics of this menu:
- The fields shown in the report have borders applied to them by borders.
- Reports are given a title and caption using title & caption.
- The size of the cells displaying the data can be customized using Cell Size.
- Workbook Theme gives the entire workbook a central theme.
Server Menu
If you have access to the Tableau server, click the Server Menu to log in and publish your findings for public consumption. It’s also used to access workbooks that other people have published. The following are the salient characteristics of this menu:
- Publish Workbook makes the workbook available for other users to access on the server.
- Create User Filters modifies the worksheet so that different users can apply filters when viewing the report.
- The workbook’s source data is made public by selecting Publish Data Source.
Finetune your skills with our data science with R programming course in Chennai.
Design Flow in Tableau
Tableau’s ability to analyze large amounts of data across a variety of dimensions, periods, and metrics means that creating a meaningful dashboard or narrative requires very careful planning.
As a result, understanding how to create a quality dashboard is crucial. Here are the elements that are involved in the design flow of Tableau:
Step 1: Connect to the Data Source
Tableau is compatible with all widely used data sources. Once the connection settings are specified, it contains built-in connectors that take care of making the connection.
Tableau links to almost all types of data sources, including relational databases, cloud databases, simple text files, and SQL sources.
Step 2: Build Data Views
All of the columns and data available in the Tableau environment are accessible once you establish a connection to a data source.
- You categorize them as measures and dimensions and establish any necessary hierarchies.
- These are used to create views, which were referred to as reports in the past.
- Tableau offers a simple drag-and-drop feature for creating views.
Step 3: Enhance the Views
The previously mentioned views require additional improvement through the application of filters, aggregations, axes labeling, color, and border formatting, among other techniques.
Step 4: Create Worksheets
To provide various perspectives on the same or different data, build distinct worksheets.
Step 5: Create and Organize Dashboards
Dashboards are made up of several linked worksheets. Hence, the action in any of the worksheets might change the outcome in the dashboard correspondingly.
Step 6: Create a Story
- A sheet with a series of worksheets or dashboards that combine to provide information is called a tale.
- You can use stories to illustrate the relationships between facts, give context, illustrate how choices affect results, or just present a strong argument.
Our data analytics training program covers everything from basic to advanced concepts.
File Types in Tableau
Tableau data analysis results can be delivered and saved in a variety of formats. The numerous file types that correspond to the different formats are distinguished by their distinct extensions. All of them are kept as editable and readable XML files.
- Tableau Workbook: It includes details on every sheet and dashboard found in a worksheet. The extension of the tableau workbook is “.twb.”
- Tableau Packaged Workbook: Both the local data utilized in the analysis and the specifics of a workbook are contained in this file format. The extension of the packaged workbook is “twbx.”
- Tableau Data Source: This file contains the connection information used to generate the tableau report. The extension of the tableau data source is “tds.”
- Tableau Packaged Data Source: With the addition of data and connection information, this file resembles the “.tds” file. The extension of the tableau packaged data source is “tdsx.”
- Tableau Data Extract: The highly compressed columnar data formatted data used in a.twb file is contained in this file. The extension of the tableau data extract is “tde.”
- Tableau Bookmark: One worksheet that can be shared and easily copied into other workbooks is included in these files. The extension of the tableau bookmark is “tbm.”
- Tableau Preferences: The color preferences used in each worksheet are stored in this file. Its primary purpose is to ensure that users have a uniform look and feel. The extension of tableau preferences is “.tps.”
Power up your career with our PowerBI training in Chennai.
Data Types in Tableau
Tableau is a data analysis program that groups all of your data into four categories: datetime, string, number, and boolean. The following details describe the data types that Tableau supports:
- String: Any combination of one or more characters. They are contained in single quotation marks. Example: ‘Hi SLA’
- Number: Either floating points or integers make up these. Example: 318 or 3.18
- Boolean: These are sensible principles. Example: True or False
- Data & DateTime: Dates are recognized by Tableau in nearly every format. However, if we need to make Tableau perceive a string as a date, we can do so by preceding the data with a # symbol. Example: “10/10/2024” & “#10 October 2024”
Learn data visualization with our MSBI course in Chennai.
Advantages of Tableau
The following are the key benefits of Tableau:
- User-Friendly Interface: Complex coding or SQL queries are not necessary to create data visualizations due to the design’s ease of use and intuitiveness.
- Sturdy Data Visualization Features: Text, graphic objects, visualizations, and other elements are used in the Dashboards feature, which has an easy-to-learn drag-and-drop interface.
- Responsive Dashboard with Mobile Support: Tableau Dashboard provides a superb reporting option that can configure the dashboard specifically for a given device, like a laptop or mobile phone.
- Capable of handling big data sets: Tableau can efficiently handle millions of rows of data.
- Implementation Ease: Tableau provides a variety of visualization options that enhance the user experience.
- Make Interactive Visualizations Fast: With Tableau, creating an interactive presentation is a simple process thanks to its drag-and-drop functionality.
- Using several programming languages with Tableau: To work around performance issues and execute intricate table computations in Tableau, users might incorporate Python or R.
Conclusion
Learn to help companies integrate and manipulate data with the understanding of fundamentals through this Tableau tutorial. Gain expertise with our Tableau training in Chennai.